

Explore Quality, DFM & Procurement Guides
Parts that each measure within tolerance can still fail to assemble. Stack-up analysis is the exercise that explains why: it adds the variation of every dimension along a chain and asks whether the result still works when each one lands at its worst permitted value.
What tolerance stack-up analysis is
Adding the variation along a dimension chain to check the fit.
A stack-up follows a path through an assembly from one interface to another, collecting every dimension that affects the result. Each contributes its own tolerance, and the analysis combines them to give the total variation at the point that matters — whether a gap closes, whether a cover seats, whether a shaft reaches far enough into a bore. The output is a predicted range for the critical dimension, which is then compared with what the design requires.
The reason it matters is that tolerance does not stay local. A designer who controls each part sensibly can still produce an assembly that fails at the extremes, because five modest tolerances along one chain can add up to more variation than the clearance available. Stack-up makes that visible on paper rather than at the assembly bench.
Worst-case and statistical methods
Two approaches are used, and they answer different questions. Worst-case analysis assumes every dimension arrives at the limit that makes the result worst, which gives the extremes the assembly could theoretically see. It is the conservative method, and it is the right one where failure is unacceptable or where quantities are small enough that an extreme is plausible.
| Method | Assumption | When to use it |
|---|---|---|
| Worst case | All dimensions at their worst permitted limit | Safety-critical joints, low volume, guaranteed fit |
| Statistical (root sum square) | Variations combine randomly, not all at the extremes | High-volume production with capable processes |
| Monte Carlo | Simulates distributions for each dimension | Complex assemblies with many contributors |
Statistical methods give a tighter predicted range, because the probability of every dimension sitting at its worst limit simultaneously is small. They are appropriate when the processes are in control and the volume is high, but they must be used knowingly: a statistical result accepts a small risk of a non-conforming assembly, and that risk has to be acceptable in the application. Related tolerance guidance is collected under standards and tolerances.
How to build a stack from a drawing
The method is mechanical once the path is chosen. Identify the critical dimension that must be controlled, then trace a chain of dimensions from one end of it to the other, following the assembly. Write each dimension with its tolerance, note the direction it acts in, and add the contributors. Dimensions that help close a gap act in one direction; those that open it act in the other, and the two sets are combined accordingly.
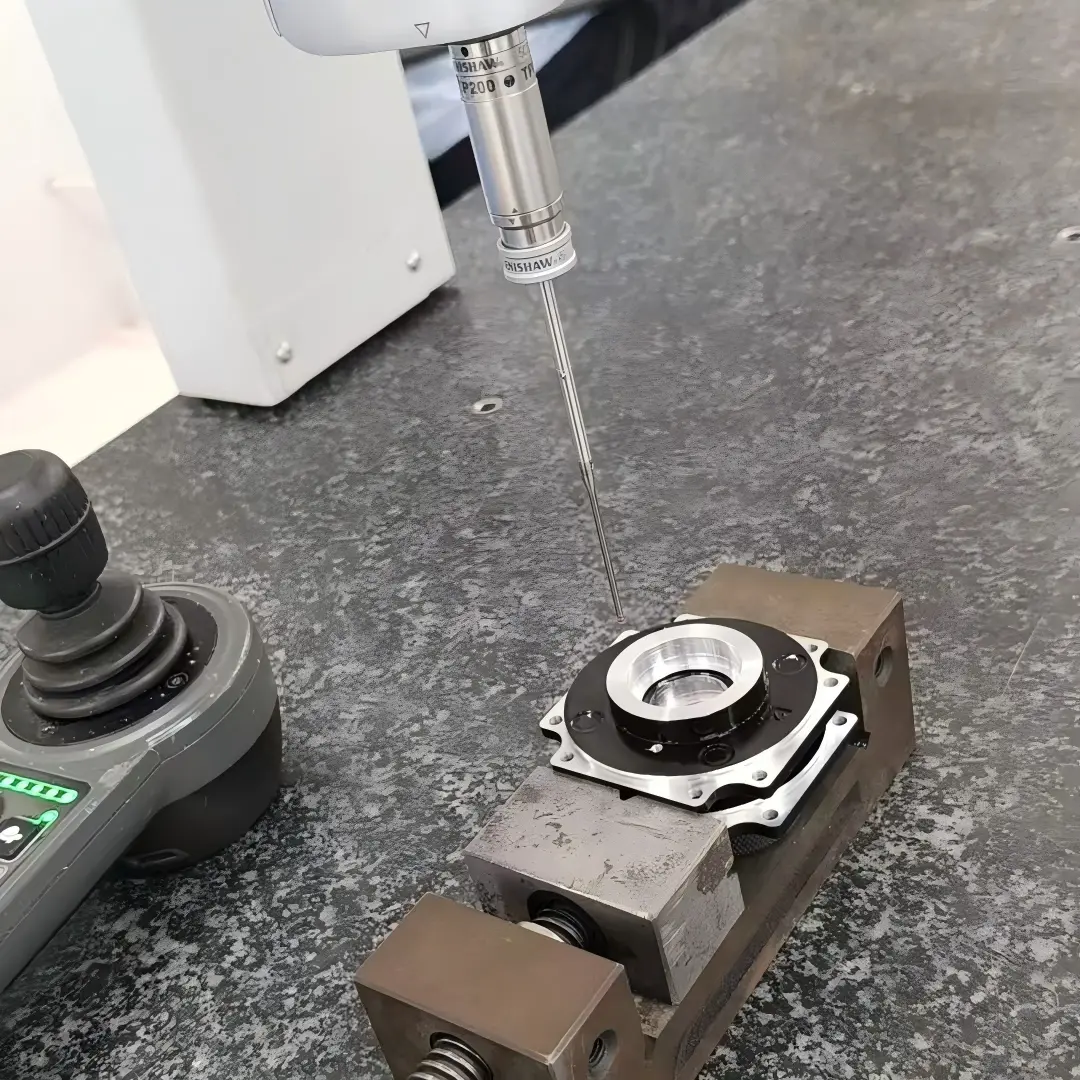
Two habits make the exercise reliable. Choose the path that includes every dimension that genuinely affects the result and no others, because an unnecessary contributor inflates the predicted range and leads to tighter tolerances than the design needs. And record which datums the dimensions are measured from, because a chain is only valid if each link is measured from the reference the next link assumes. Software tools automate the arithmetic, but the path and the datums are engineering decisions that no tool can make. Measurement practice is described by the NIST Manufacturing Extension Partnership.
Common mistakes that make a stack useless
Four errors recur. Mixing methods within one analysis, so that some contributors are treated worst-case and others statistically, which produces a number that means nothing. Forgetting contributors that are not dimensions, such as thermal expansion, coating thickness or the effect of a weld, which shifts the assembly without appearing on the drawing. Using nominal geometry where form tolerances matter, because flatness, perpendicularity and position all consume clearance in ways a simple length chain does not show. And building the stack from the part drawings rather than the assembly drawing, which loses the datum relationships that the assembly establishes.
The corrective habit is to state the assumption behind every contributor. A stack-up is a model, and a model is only as good as the effects it includes. Where an effect is uncertain, such as the flattening of a rough surface under a gasket load, naming it as an assumption is more useful than leaving it out. Drawing conventions follow ASME standards, and material references are published by ASM International.
Using the result to change the design
A stack-up is worth more as a design tool than as a report. If the predicted range exceeds the requirement, four responses are available in order of preference. Move the variation out of the critical chain by redesigning the joint, which costs nothing at the drawing stage. Choose a different fit or a larger clearance, accepting the function change. Allocate tighter tolerances to the contributors that dominate, which raises cost. Or add an adjustment or shim to absorb the variation, which solves the assembly at the cost of a process step.
The order matters because it reflects cost. Tightening tolerances is easy to specify and expensive to deliver, while redesigning the chain is inexpensive if it happens before the design is frozen. That is why stack-up analysis belongs early in a programme rather than as a check before release.
What a stack-up report should contain
A usable report states the critical dimension and what it must achieve, lists every contributor with its nominal value and tolerance, states the method used, and gives the resulting range against the requirement. It should also name the assumptions, particularly any effect that was modelled rather than measured and any contributor that was left out deliberately.
Two additions make it useful to a supplier. Identifying which contributors dominate shows where manufacturing attention should go, and stating which dimensions may be relaxed if the process cannot hold everything gives the shop a way to propose a cheaper alternative without compromising the function. Surface and coating terminology follows ASTM Committee B08, and process obligations are set out by the US EPA. Machining routes for the tightest features are described under precision machining.
Send the assembly with the dimension that must be held, and request a quote with the dominant tolerance contributors identified.
FAQ
What is tolerance stack-up analysis?
It adds the variation of every dimension along a chain in an assembly to predict the total range at the point that matters, such as a gap or an interface. The result is compared with what the design requires to see whether parts that are individually in tolerance will still assemble.
How do you calculate a tolerance stack?
Choose the critical dimension, trace a chain of dimensions from one end to the other, list each with its tolerance and direction, and combine them. Worst-case analysis takes every dimension at its worst limit; statistical methods combine them by root sum square assuming random variation.
What is the difference between worst-case and statistical stack-up?
Worst-case assumes every contributor sits at its worst permitted limit, giving a guaranteed range and a conservative design. Statistical methods give a tighter range but accept a small probability of a non-conforming assembly, so they suit high-volume capable processes.